Morning Brief: November 12, 2026 — Jobless claims rise to 200,000
Jobless claims rose while their four-week average held steady. Nasdaq futures weakened, and Nebius earnings put AI revenue quality and funding in focus.
Thursday, November 12 · Before the U.S. open · Research cutoff: 8:40:45 a.m. Eastern.
New U.S. unemployment claims rose to 200,000 last week, but the four-week average was unchanged. That makes this morning’s labor report a measured counterpoint to the sharper swings in technology: Nasdaq futures were lower before the open, and Nebius disclosed how much a new partnership model contributed to its quarterly revenue.
The distinction matters heading into Thursday’s session. A move in an AI stock can reflect company-specific questions about leadership, contracts or financing. It should not automatically become a verdict on the entire economy.
Overnight: yesterday’s rally meets a weaker futures market
Wednesday’s regular U.S. session finished higher. The S&P 500 closed at 7,619.38, up 1.3%; the Dow at 52,486.49, up 0.5%; and the Nasdaq Composite at 25,466.19, up 1.6%. These are completed cash-session results, not this morning’s indications. Wednesday’s close.
| Premarket instrument | Level / change | Quote time, Eastern |
|---|---|---|
| December E-mini S&P 500 futures | 7,584.25 / -0.74% | 8:29:48 a.m. |
| December E-mini Nasdaq-100 futures | 28,087.25 / -1.36% | 8:29:47 a.m. |
| DAX cash index, intraday | 26,740.99 / +0.29% | 8:24:50 a.m. |
These delayed quotes were retrieved at 8:39:50 a.m. Futures changes use each contract's prior futures close; the DAX change uses its prior cash close. They are separate observations, not one synchronized market print. S&P futures · Nasdaq futures · DAX.
In Asia, Japan’s Nikkei 225 finished at 60,819.36, down 0.70%, while Hong Kong’s Hang Seng closed at 24,008.55, down 1.26%. Nikkei historical data · Hang Seng quote.
The lead: a weekly increase without a rising four-week trend
The Labor Department’s 8:30 a.m. release put seasonally adjusted initial claims at 200,000 for the week ended November 7, up 9,000. The comparison uses a revised 191,000 for the previous week, rather than the 189,000 initially reported.
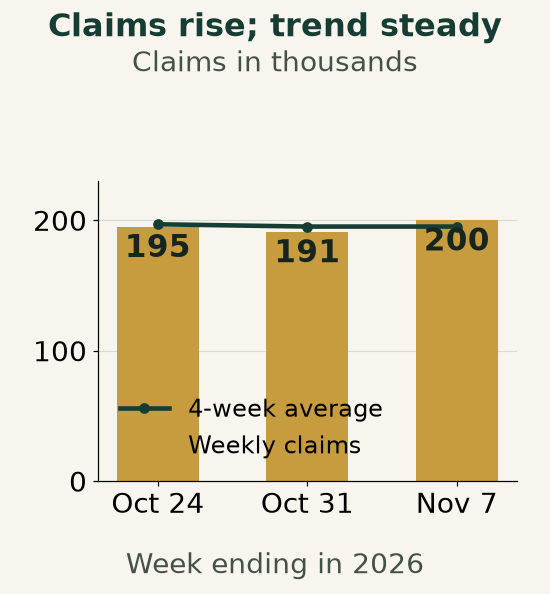
The four-week average held at 195,250. Continuing insured unemployment fell by 20,000 to 1.697 million, but covers the earlier week ended October 31. Together, these figures do not establish an accelerating wave of layoffs. They also do not measure every unemployed person or settle the outlook for hiring.
For markets, the useful discipline is to keep the size of the claim proportional to the evidence. One weekly increase deserves attention. An unchanged average offers little basis for turning it into a new trend.
The AI desk: Nebius revenue grew, with an important change in mix
Nebius Group, which trades on Nasdaq as NBIS, reported $980.8 million in third-quarter revenue. Approximately $325 million came from a non-recurring initial rollout in which partners deploy Nebius technology on capacity they fund. That is about one-third of reported group revenue, using the company’s approximate amount. Quarterly results · Shareholder letter.
The revenue is part of a disclosed business model. The question is how readily it repeats. Annualizing the whole quarter as though every dollar came from ongoing use of live cloud capacity would go beyond the disclosure. Equally, subtracting the rollout amount would not magically produce a verified recurring-revenue measure.
Continuing operations used $273 million in cash during the quarter. Management now expects 2026 revenue at the low end of its existing $3.0 billion–$3.4 billion range and capital spending of about $27 billion. Those forecasts put collection timing and construction spending alongside revenue growth as questions for the business.
Nvidia traded at $158.45 in the 8:39:49 a.m. premarket observation, about 8.8% below Wednesday's $173.73 regular close. That price move does not establish a particular cause or a completed leadership change. Nvidia quote · Background: our November 11 coverage of the board reports.
Elsewhere in technology, GFT replaced its numerical 2029 revenue ambition while retaining its margin goal. Our earlier analysis of GFT’s disclosure examines how AI productivity changes the link between hours worked, sales and profits. It is context for today’s wider debate over which parts of AI growth turn into durable earnings.
Today’s calendar
- 9:30 a.m. Eastern: Regular U.S. equities session begins; the scheduled close is 4 p.m. NYSE hours and calendar.
- 1 p.m.: Treasury auctions $25 billion of 30-year bonds. The result will offer a fresh test of demand for long-term government debt. Treasury auction schedule.
- 4:30 p.m.: Cisco’s fiscal first-quarter and Applied Materials’ fiscal fourth-quarter earnings calls. These are scheduled events, not results available in this brief. Cisco · Applied Materials.
- Friday, 8:30 a.m.: October producer-price data are scheduled, according to the BLS calendar. They have not been released.
Into the open: separate the macro signal from the company question
The claims report does not, by itself, supply a broad deterioration story. Nebius supplies a different test: whether rapid revenue growth becomes repeat business and collected cash as capacity spending rises. Keep those questions separate. If selling spreads beyond technology after the cash market opens, that is an observation to establish from the session—not a conclusion already proved by premarket futures.
Sources and timing: Figures were checked during the morning research window; quote timestamps are shown separately from the cutoff. Futures are delayed indications against their own prior-close references, not forecasts of closing prices. Nebius figures are unaudited U.S.-dollar group results for the three months ended September 30; forecasts and interpretation are labeled. The claims chart is original TrendyVest work using revised government data. This brief prioritizes selected developments and does not claim complete market or earnings coverage.